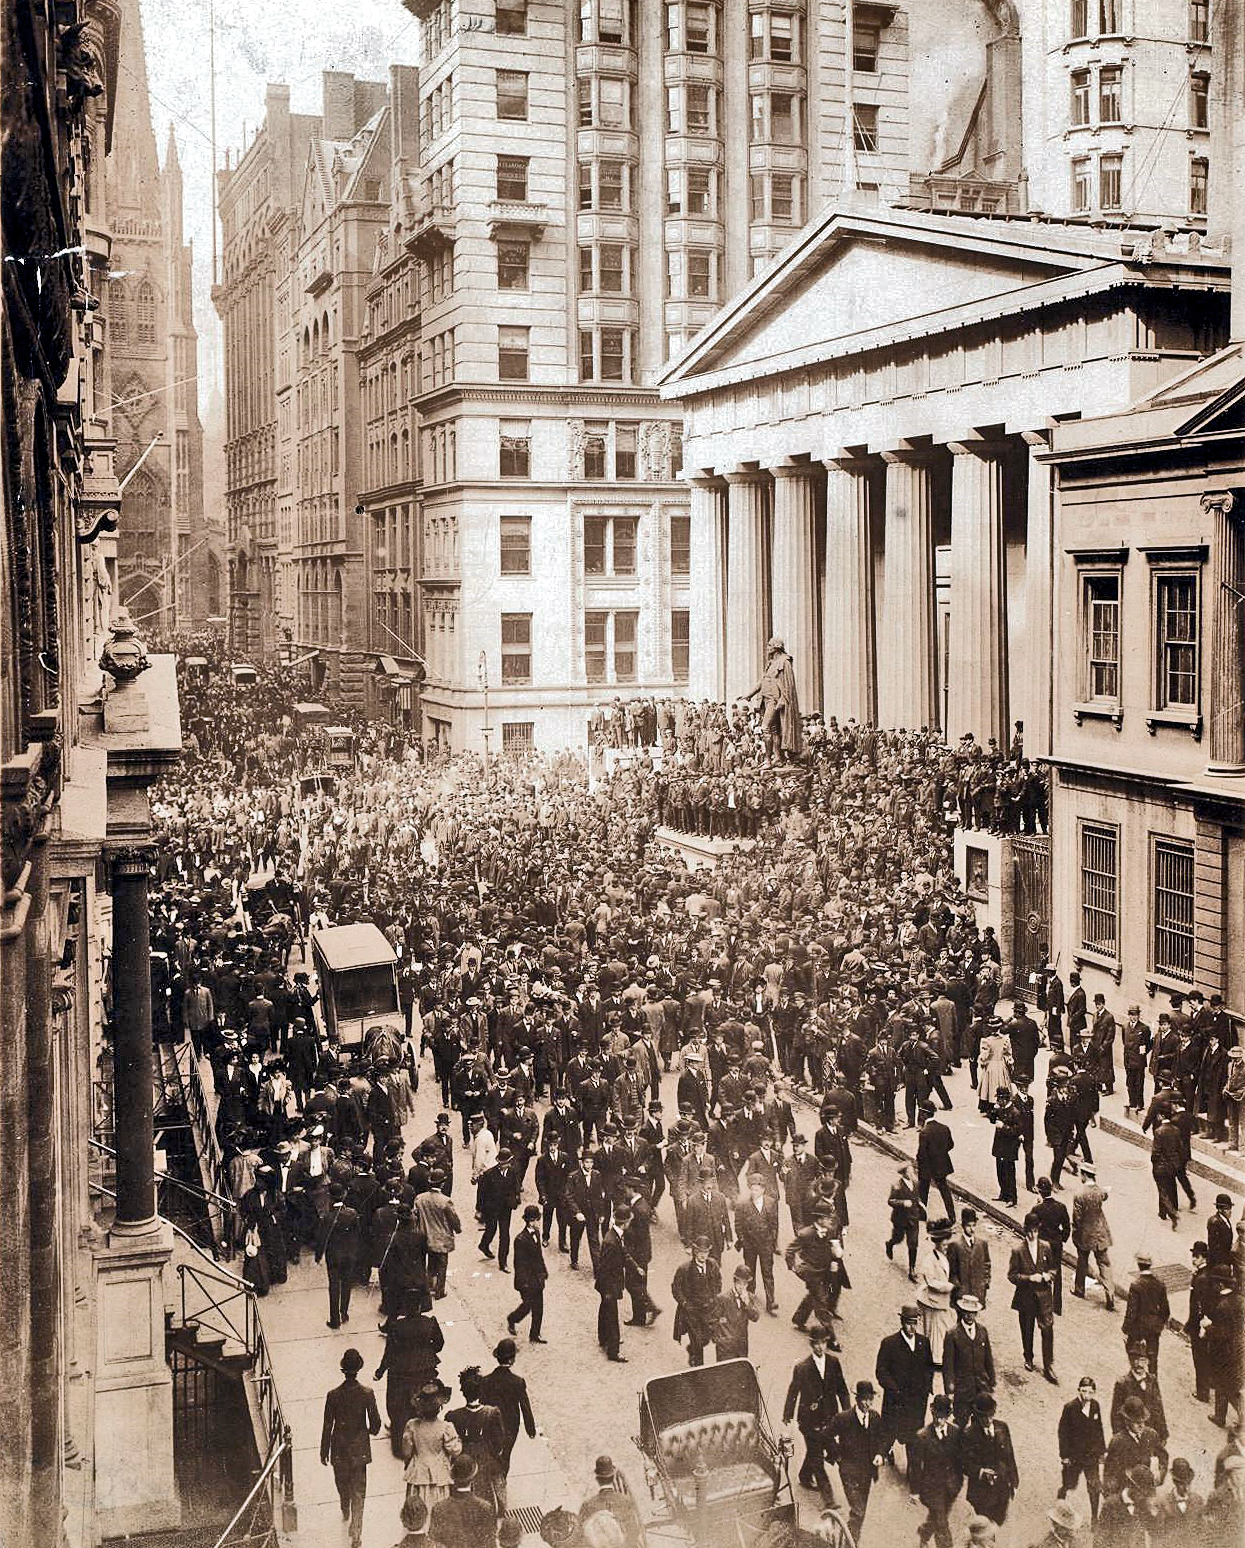
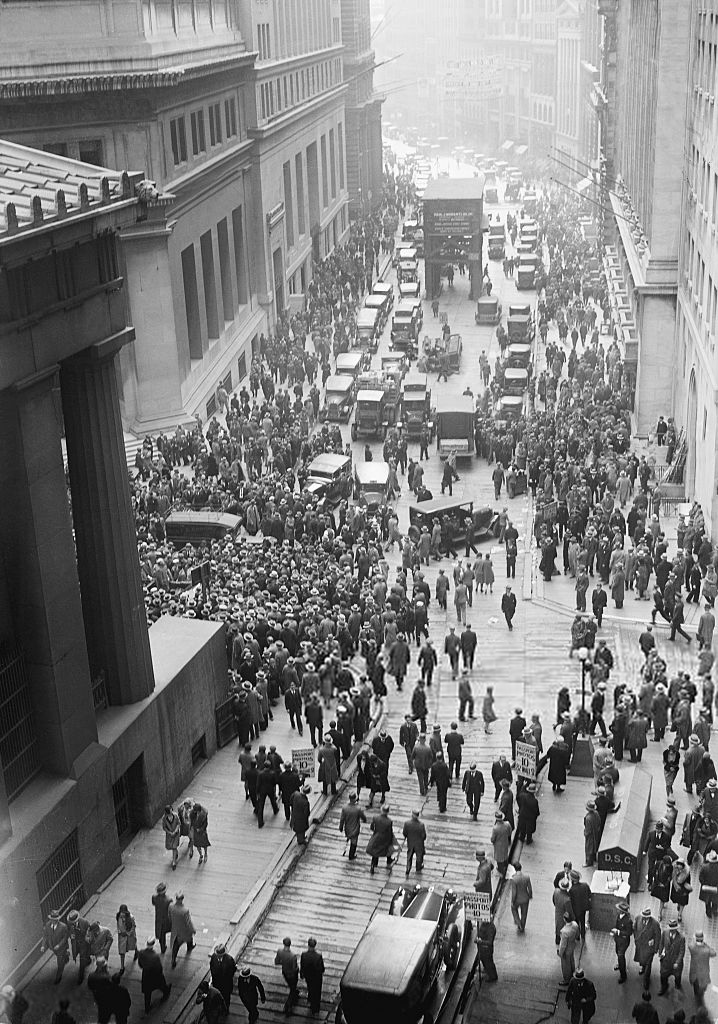
A dense crowd gathered on Wall Street during the Bankers' Panic of October 1907.
Eastern PineVentures

Eastern Pine Ventures / Market archive

Market History

How markets learned to move.

Ten turning points in speculation, information, money, and market technology, with the price record attached.

The short record comes first. The longer stories are here when you want them.

Cover plate — Crowd on Wall Street during the Bankers' Panic / October 1907 / Public domain in the United StatesNew York Public Library via Wikimedia Commons

A market crisis becomes real when people leave their desks and gather around the institution itself. That is why this photograph opens the record.

Read this first / about five minutes

The short record

Ten events, the price move, and the part worth remembering. Each line opens the longer account below.
  1. 01

    Speculation

    A new story finds a crowd

    South Sea shares surged during 1720 and then collapsed. Fortunes built on the run-up disappeared, and the crash forced a rescue and restructuring of the company.

  2. 02

    Information technology

    Prices learn to travel

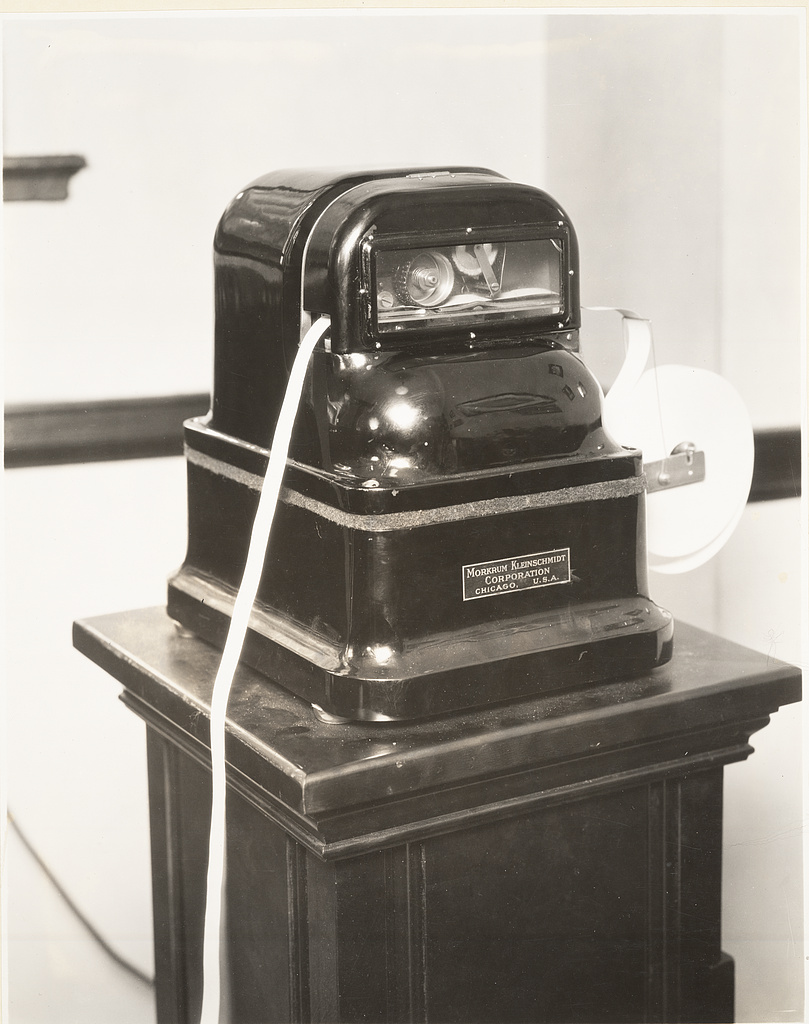
    The ticker did not create one clean boom or crash. It narrowed the information gap between the exchange and distant offices. News reached more buyers and sellers sooner, so prices could react sooner too.

  3. 03

    Liquidity crisis

    When cash stops moving

    New York's call-money rate jumped from 9.5% to 70%, then briefly reached 100%. Industrial output fell 17% in 1908 and real GNP fell 12% as the shock moved into the wider economy.

  4. 04

    Boom and bust

    The long climb and the longer fall

    The Dow rose about sixfold from August 1921 to September 1929. It fell nearly 13% on October 28 and nearly 12% the next day. By July 1932 it was 89% below the peak and would not regain that high until 1954.

  5. 05

    Money and policy

    Gold becomes policy you can photograph

    The official gold price had been $20.67 an ounce. Beginning February 1, 1934, the Treasury bought gold at $35 an ounce. That was a rise of roughly 69% in gold's dollar price and a deliberate devaluation of the dollar against gold.

  6. 06

    Monetary order

    Forty-four nations redraw the map

    The system reduced day-to-day currency movement by fixing exchange rates. In 1971 the United States suspended official dollar-to-gold convertibility; by 1973 major currencies were generally floating, allowing exchange rates and currency risk to move more freely.

  7. 07

    Electronic markets

    The market leaves the room

    Technology reduced some trading costs and helped quotes update faster, but it also gave speed a price of its own. The dot-com cycle showed the other side: the Nasdaq-100 peaked near 4,705 in March 2000 and bottomed near 805 in October 2002, a decline of more than 80%.

  8. 08

    Machine-age crash

    Black Monday tests the machinery

    The Dow Jones Industrial Average fell 22.6% in one session, the largest one-day percentage decline in U.S. market history. Other major markets also suffered sharp losses.

  9. 09

    Credit crisis

    The balance sheet breaks

    U.S. home prices fell about 30% from mid-2006 to mid-2009. The S&P 500 fell 57% from its October 2007 peak to its March 2009 low.

  10. 10

    Market data

    A crash measured in minutes

    The Dow's intraday decline reached 9.16%. It dropped another 573 points in five minutes, then recovered 543 points in roughly a minute and a half. Some stocks briefly traded for a penny.

Archive notes / sourced reading

The longer account

Historical and educational material. Not financial advice.
01

Speculation

London

A new story finds a crowd

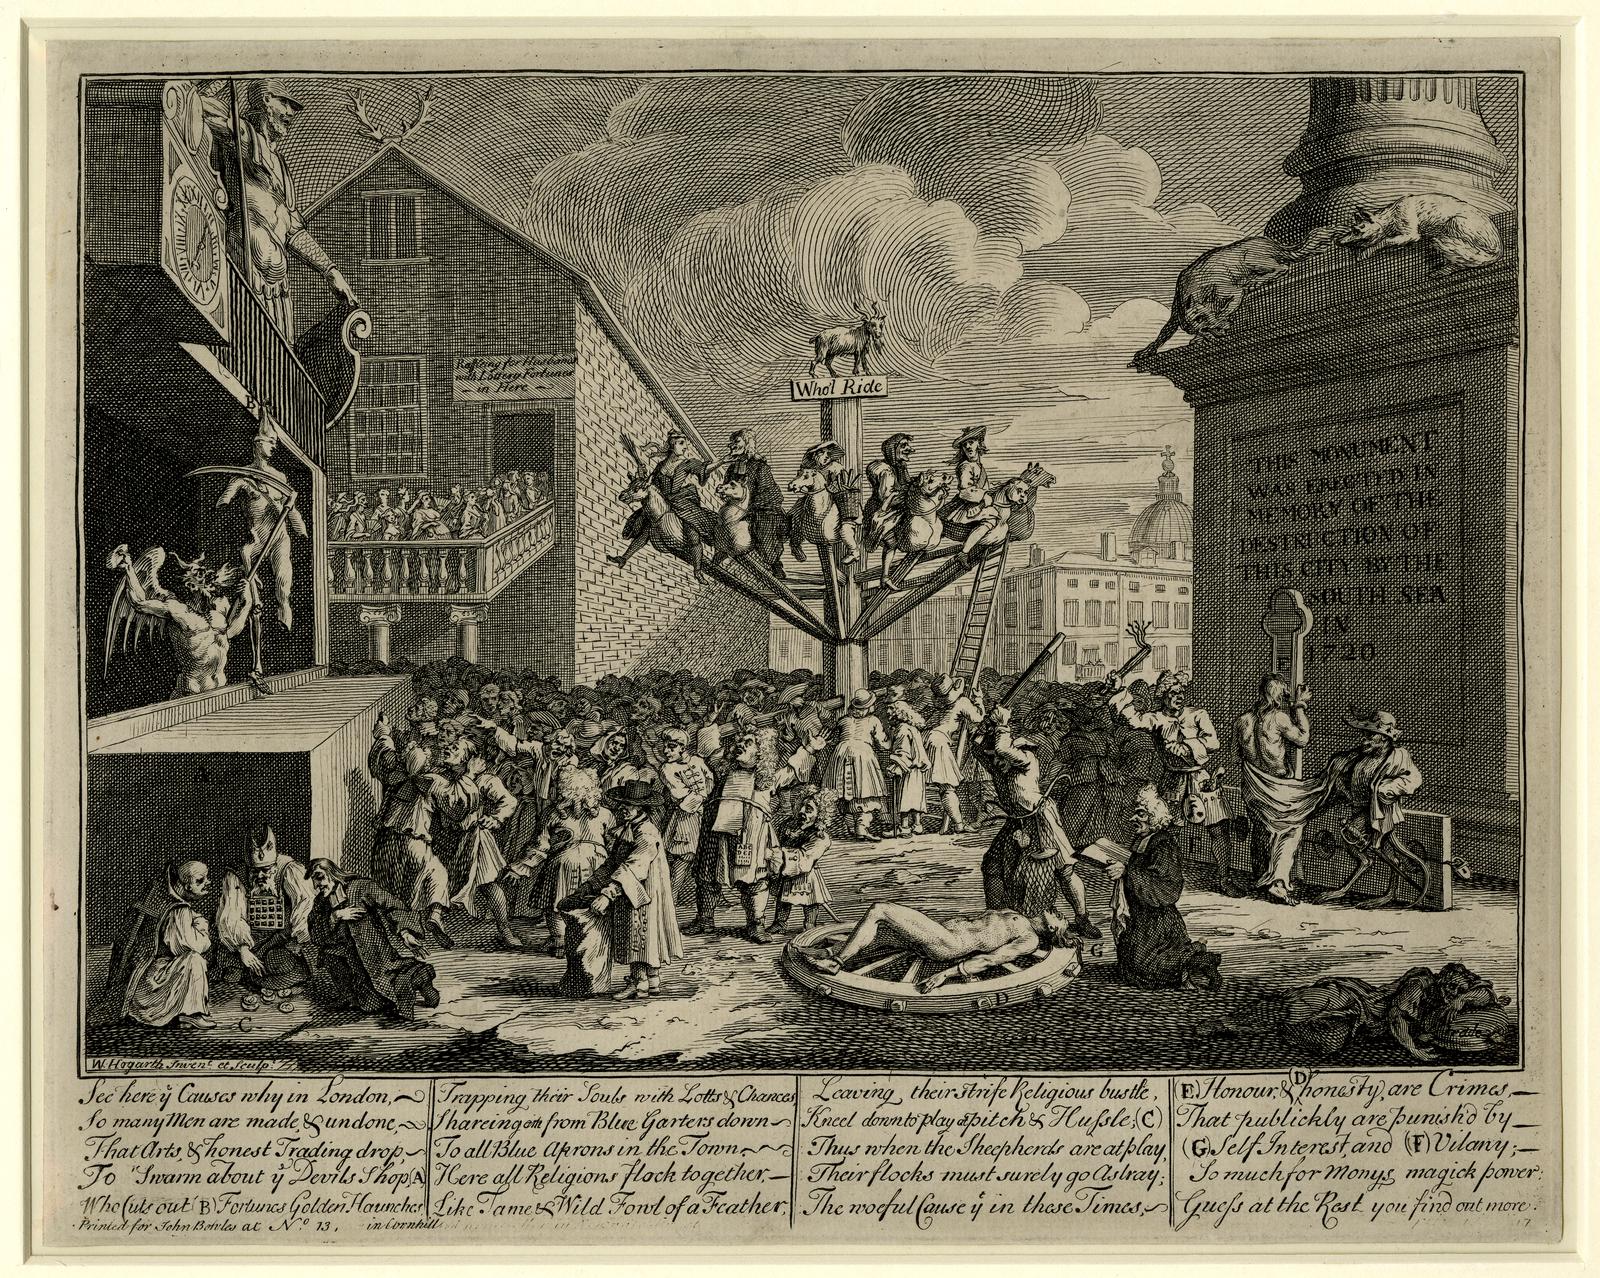
William Hogarth's crowded 1721 satire of the South Sea Bubble, with speculators circling a financial carnival.
Exhibit 01 — The South Sea Scheme / William Hogarth / 1721 / Public-domain originalBritish Museum via Wikimedia Commons

The South Sea Company offered investors a story big enough to outrun the facts. Its shares rose dramatically, the excitement spread, and a market for questionable new ventures grew around it. Then confidence broke.

On the plate. William Hogarth drew the episode as a carnival. Fortune is being cut apart, honesty is beaten, and trade sleeps while the crowd chases the ride. It belongs here because a bubble is not only a price chart. It is a social event with salesmanship, status, envy, and fear of missing out.

A convincing story can move price long before the underlying value is clear. The stranger the promise, the more useful it is to write down what would prove it wrong.
02

Information technology

New York / Chicago

Prices learn to travel

A 1926 Morkrum-Kleinschmidt ticker instrument with a strip of market tape emerging from it.
Exhibit 02 — Morkrum-Kleinschmidt ticker / Chicago / 1926Library of Congress

Before automatic tickers, quotes were copied and relayed by messengers or telegraph operators. Edward Calahan's practical ticker turned trades into electrical signals and printed them onto a narrow paper tape. Market information could leave the exchange while it was still useful.

On the plate. This Morkrum-Kleinschmidt machine is from 1926, decades after the first ticker. The paper curling out of it is an early market feed: compact, continuous, and already capable of changing who knew what and when.

A feed is never neutral. Whoever receives it first, understands it best, or notices when it is wrong has an advantage. Modern data systems are faster, but the question is unchanged.

03

Liquidity crisis

Wall Street

When cash stops moving

The Panic of 1907 began with failed speculation and spread through banks and trust companies. Depositors wanted cash at the same time. Lenders pulled back. Institutions that looked sound in ordinary conditions suddenly had to prove they could survive a run.

On the cover. The crowd outside Federal Hall makes the crisis physical. These are not abstract points on a chart; they are people trying to understand whether the system will hold. Money is partly a network of promises, and a crowd forms when those promises are doubted.

A market can have plenty of assets and still fail when nobody will lend against them. Liquidity is easy to ignore in calm weather and impossible to ignore in a panic.

04

Boom and bust

New York

The long climb and the longer fall

A solemn crowd gathered outside the New York Stock Exchange after the 1929 crash.
Exhibit 04 — Crowd outside the New York Stock Exchange / 29 October 1929 / Public domainU.S. Government via Wikimedia Commons

The 1920s bull market made rising prices feel ordinary. Credit was easy, participation widened, and the Dow climbed for years. The crash arrived in violent bursts, but the damage did not end when the famous trading days were over.

On the plate. This crowd gathered outside the New York Stock Exchange on October 29, 1929. The important detail is the stillness. People came to the building because price information, personal savings, and public confidence had suddenly become the same story.

The headline crash was an event. The loss of wealth, credit, employment, and confidence was a process. A drawdown can outlast the story that first explains it.

05

Money and policy

United States

Gold becomes policy you can photograph

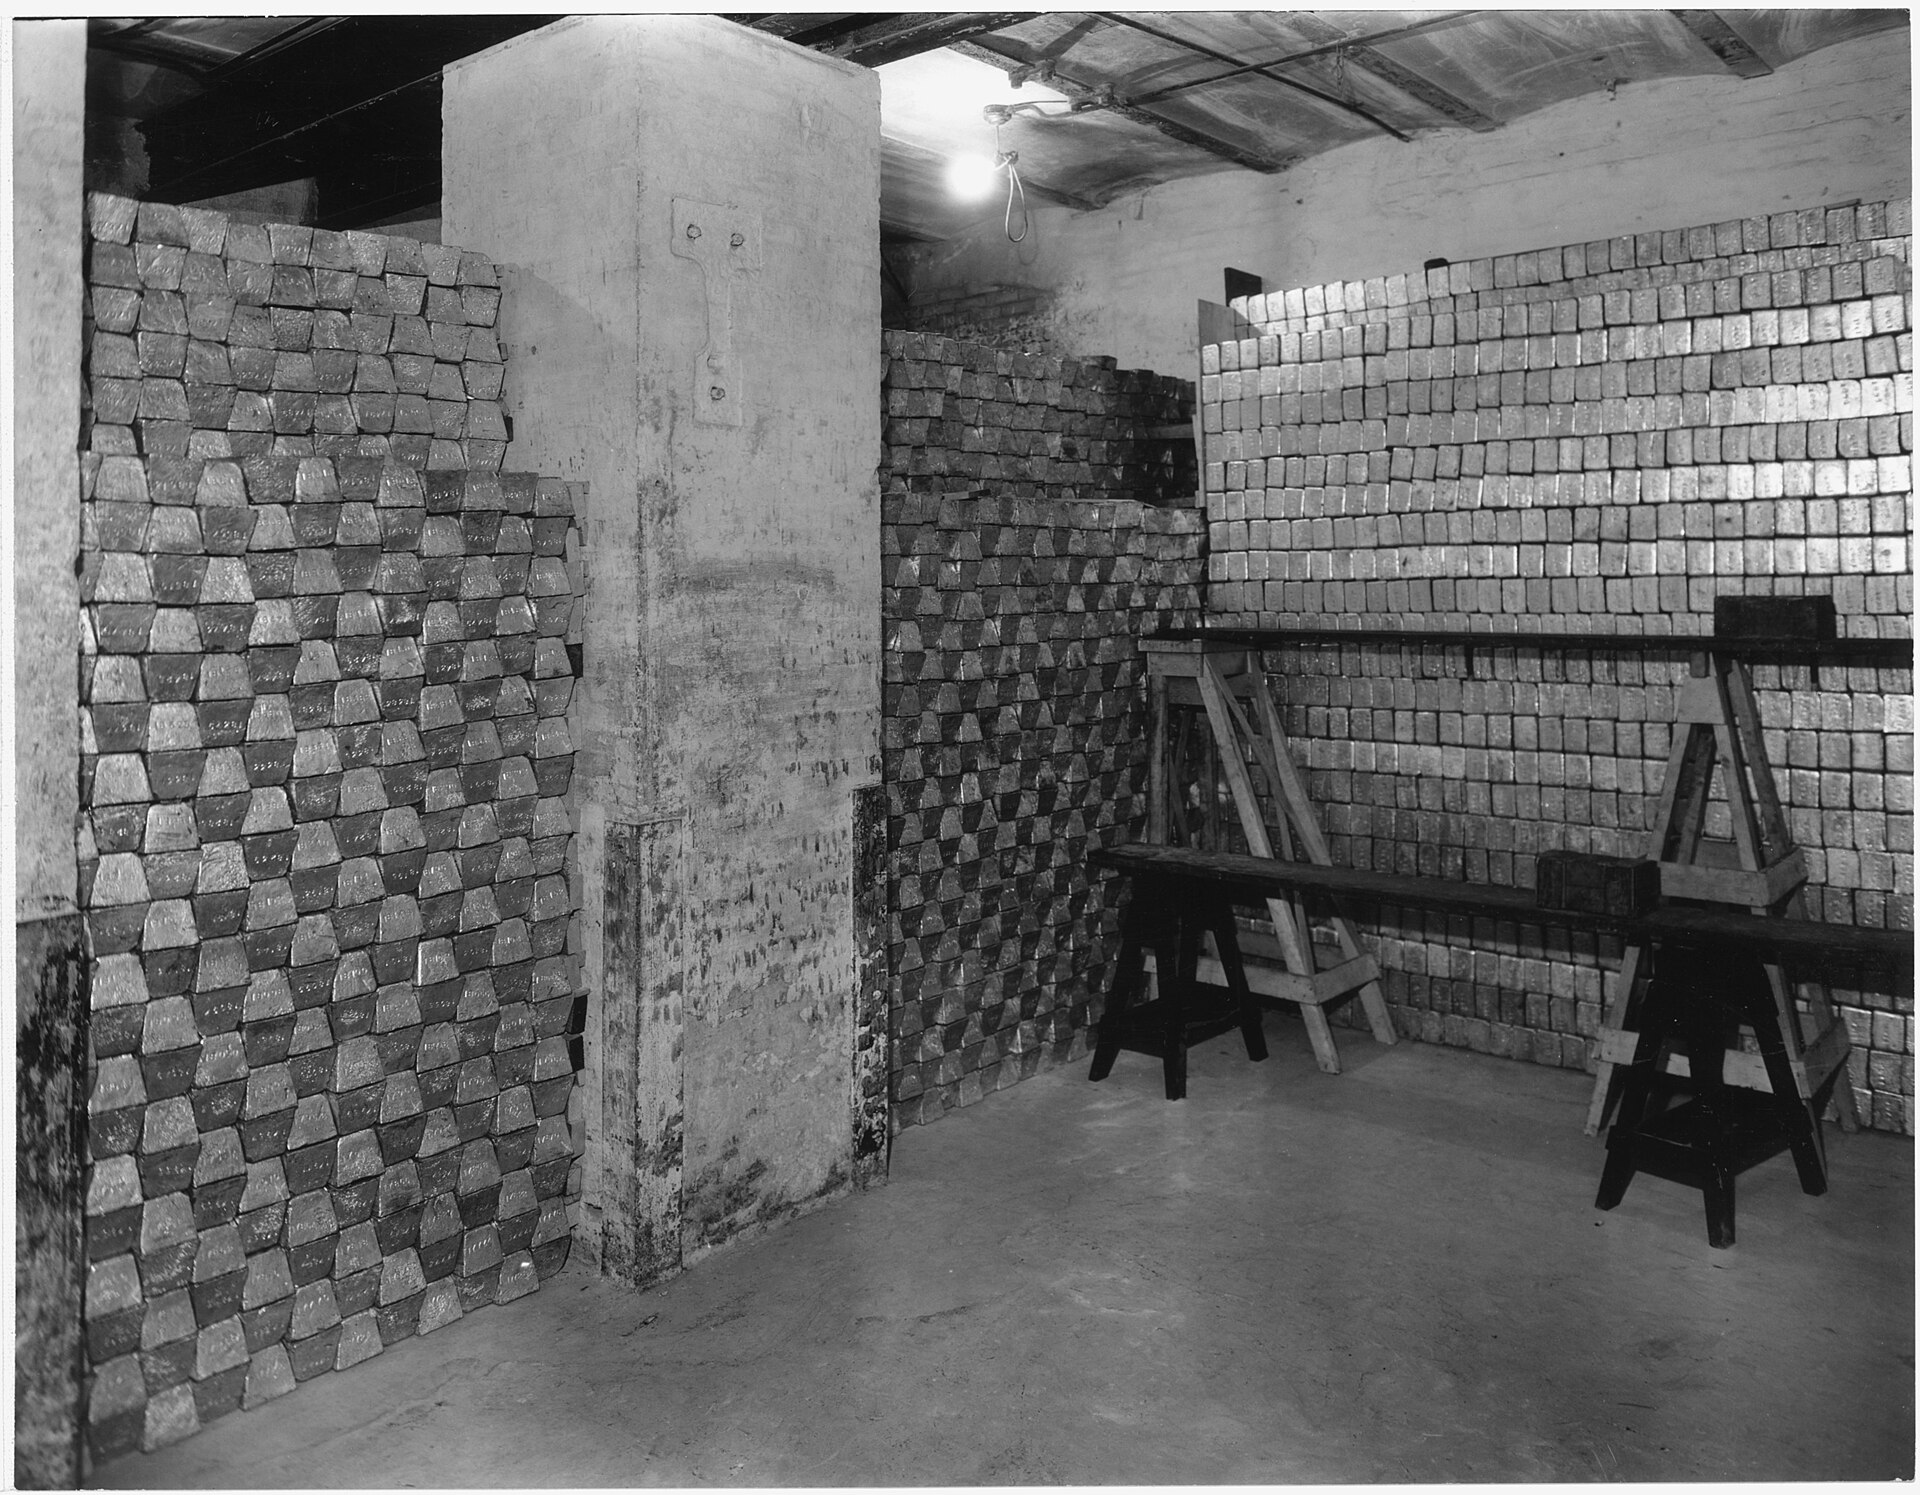
Rows of stacked gold bars filling a United States Mint vault in San Francisco around 1935.
Exhibit 05 — U.S. Mint vault with gold bars / San Francisco / c. 1935 / Public domain / NARA 296609U.S. National Archives / U.S. Mint

During the Depression, the United States changed the dollar's relationship to gold and concentrated enormous reserves in purpose-built depositories. Fort Knox became the famous symbol, but it was one piece of a larger custody system.

On the plate. These bars were photographed in a U.S. Mint vault in San Francisco around 1935. They are not inside Fort Knox, and that distinction matters. Good records separate what an image proves from what we want it to represent.

Money is not only metal or paper. It is also law, custody, convertibility, and public trust. A policy decision can reprice the measuring stick itself.

06

Monetary order

New Hampshire / the world

Forty-four nations redraw the map

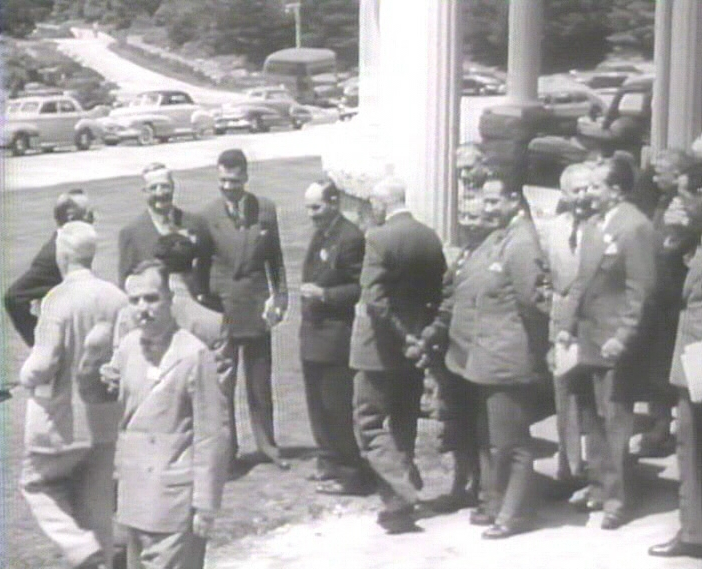
Delegates gathered after the opening ceremonies of the Bretton Woods Conference in 1944.
Exhibit 06 — Bretton Woods delegates after opening ceremonies / July 1944 / Public domainU.S. National Archives / Record Group 208

In July 1944, delegates from 44 nations met at Bretton Woods, New Hampshire. They designed institutions and exchange-rate rules for a postwar economy in which currencies were tied to the dollar and the dollar was convertible into gold for official holders.

On the plate. The people in this photograph had lived through depression, bank failures, competitive devaluations, and war. The meeting matters to markets because the rules around a currency can shape trade, capital flows, inflation, and asset prices for decades.

The rules that feel permanent usually have a history. When the monetary framework changes, old assumptions about price, risk, and value can change with it.

07

Electronic markets

Networks

The market leaves the room

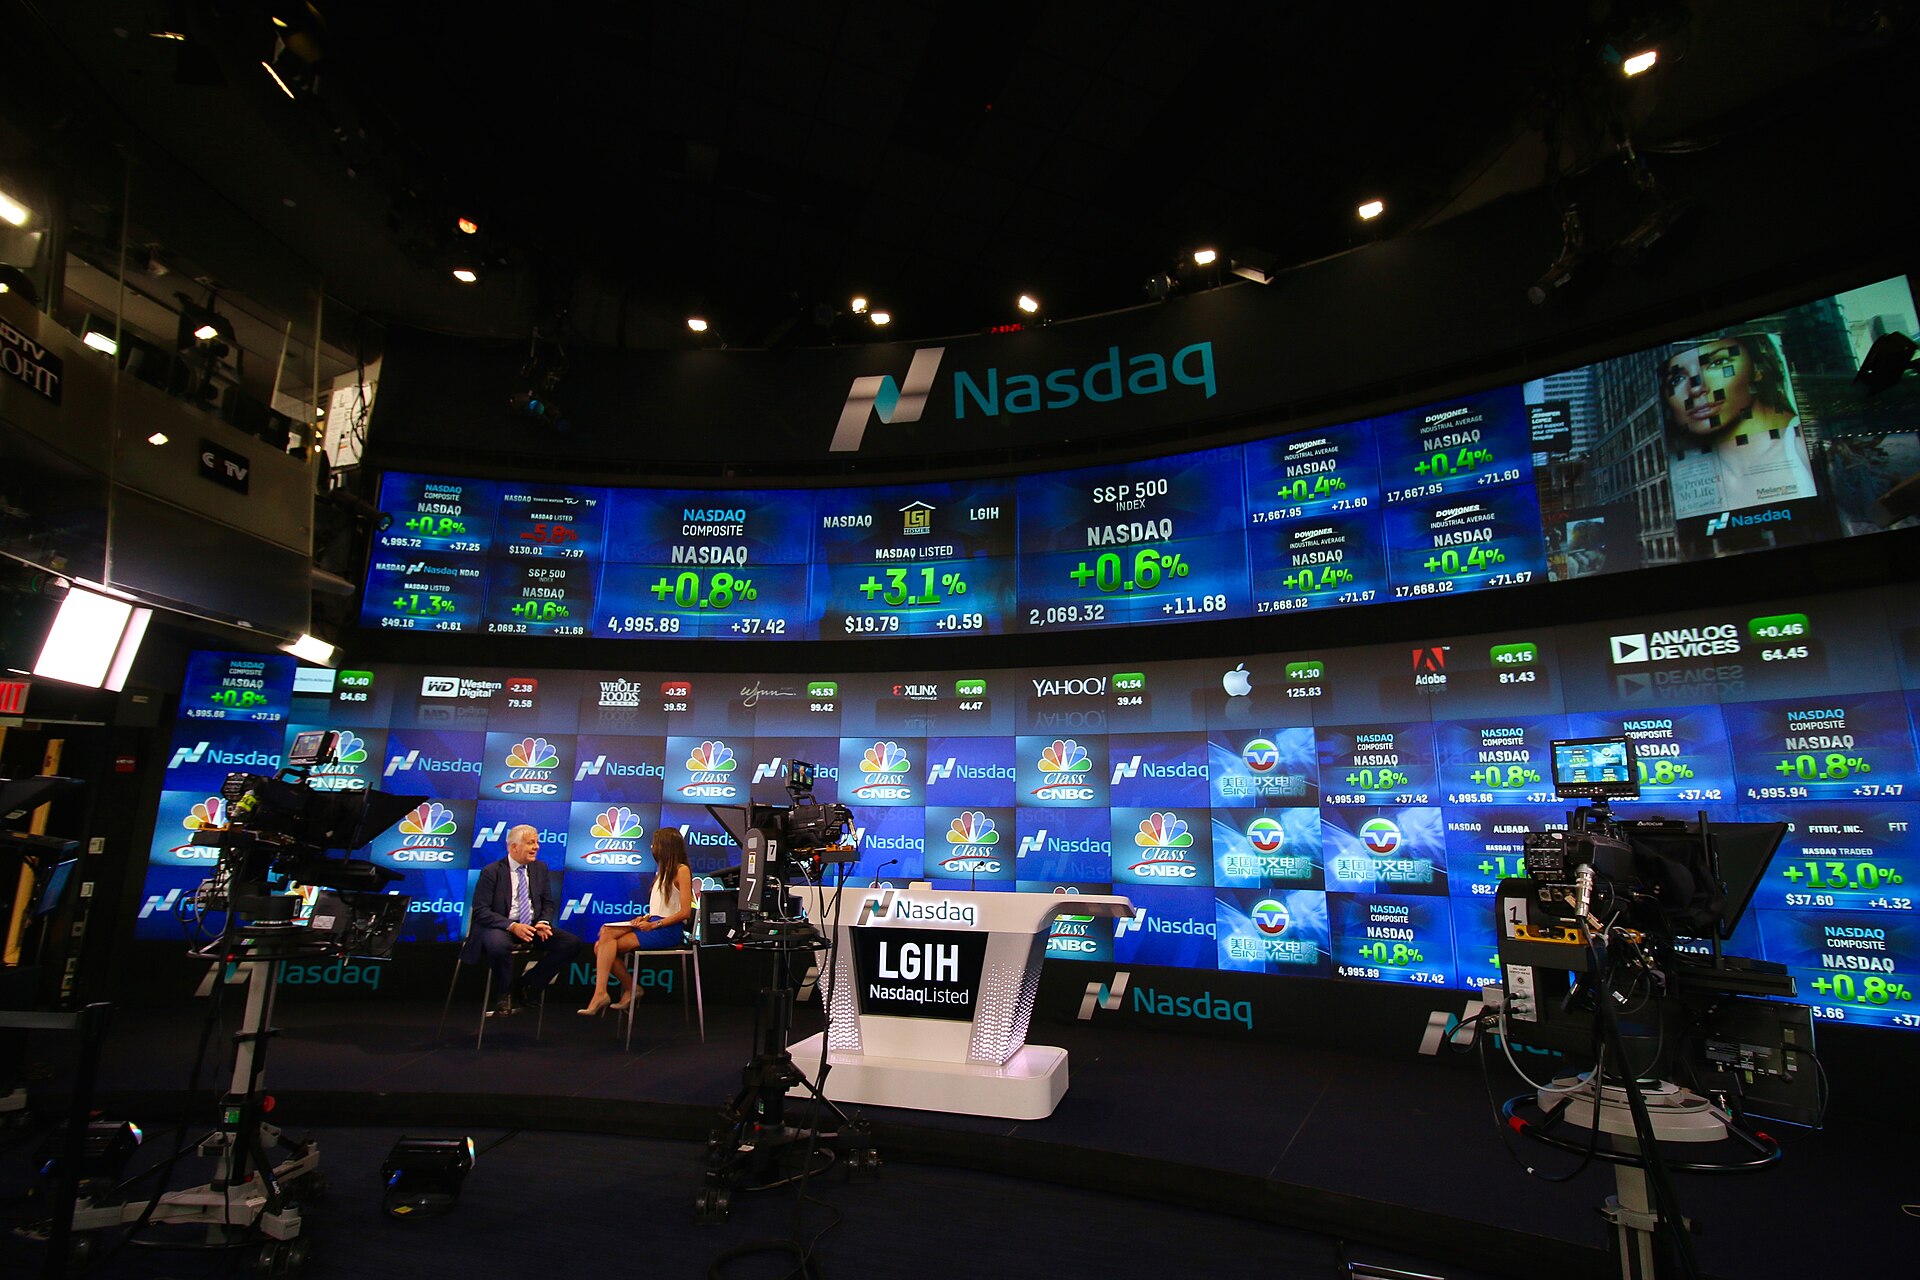
The Nasdaq MarketSite in Times Square, covered in electronic market displays.
Exhibit 07 — Nasdaq MarketSite / electronic-market era / 2015 / CC BY 2.0Luca Marfè via Wikimedia Commons

Electronic communication networks, Nasdaq's electronic quotation system, automated routing, decimal pricing, faster data, and co-location changed the market in layers. There was no single birthday for high-frequency trading. There was a long transfer of work from people and paper to networks and software.

On the plate. Nasdaq's Times Square display makes a hidden electronic market visible to the public. The building is not where most of the market happens. That is exactly why it belongs here: modern price discovery lives in connected systems that most people never see.

A faster market can be a better market. It can also fail faster. Speed is useful only when the record, controls, and capacity to explain an event keep up with it.

08

Machine-age crash

Global markets

Black Monday tests the machinery

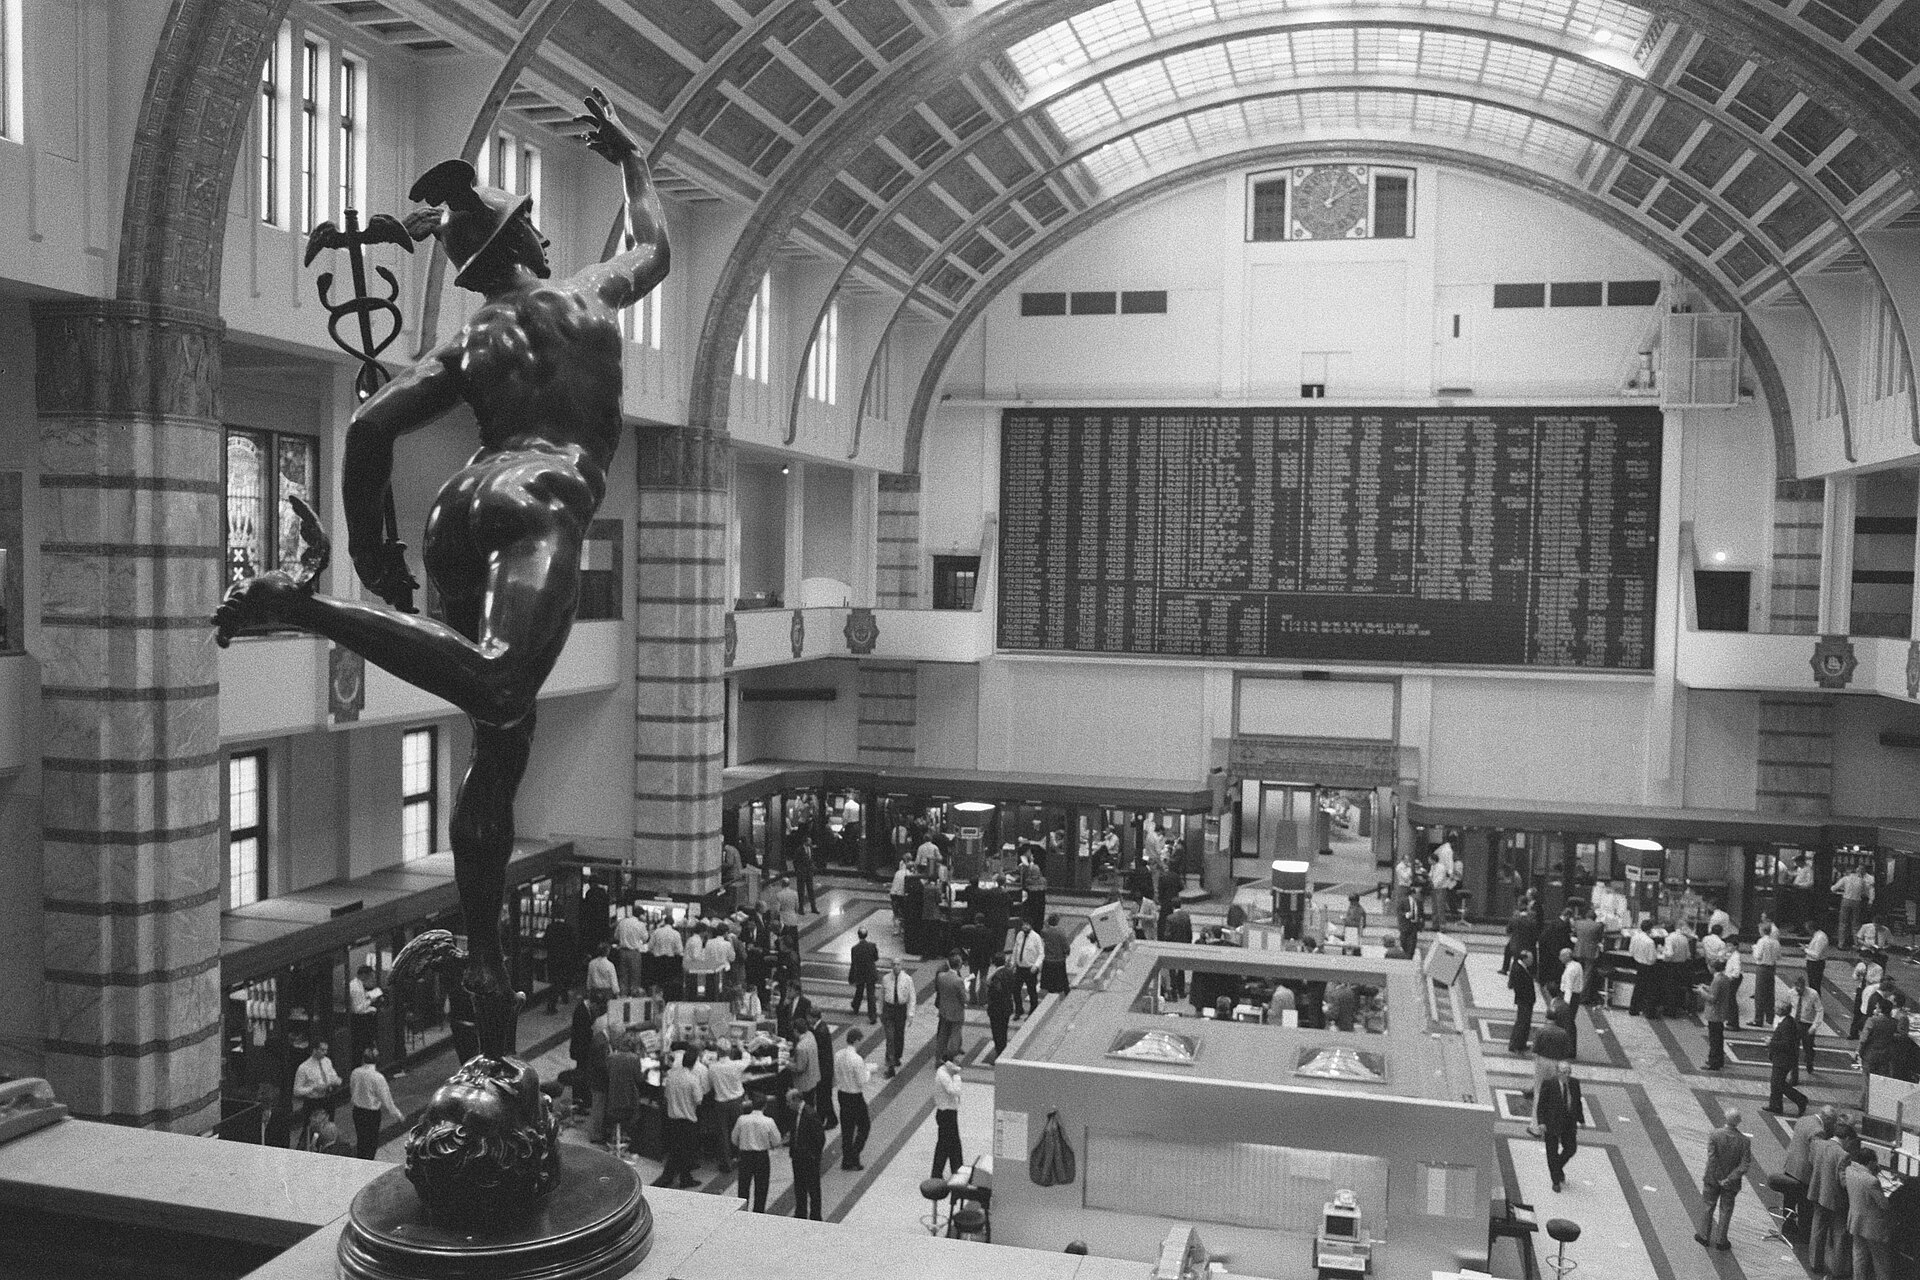
A wide view of the Amsterdam stock exchange on October 21, 1987, two days after Black Monday.
Exhibit 08 — Amsterdam exchange after the market fall / 21 October 1987 / CC0 1.0Bart Molendijk / Anefo / Dutch National Archives

On October 19, 1987, selling moved across global markets with astonishing force. Portfolio insurance, market structure, liquidity, and human fear interacted in ways no single explanation fully contained.

On the plate. This is the Amsterdam exchange two days after Black Monday. It widens the story beyond Wall Street. The crash crossed borders, and every local market had to translate a global price shock through its own people and systems.

Automation does not remove crowd behavior; it can transmit it. When many strategies rely on the same exit, the exit can disappear.

09

Credit crisis

Global finance

The balance sheet breaks

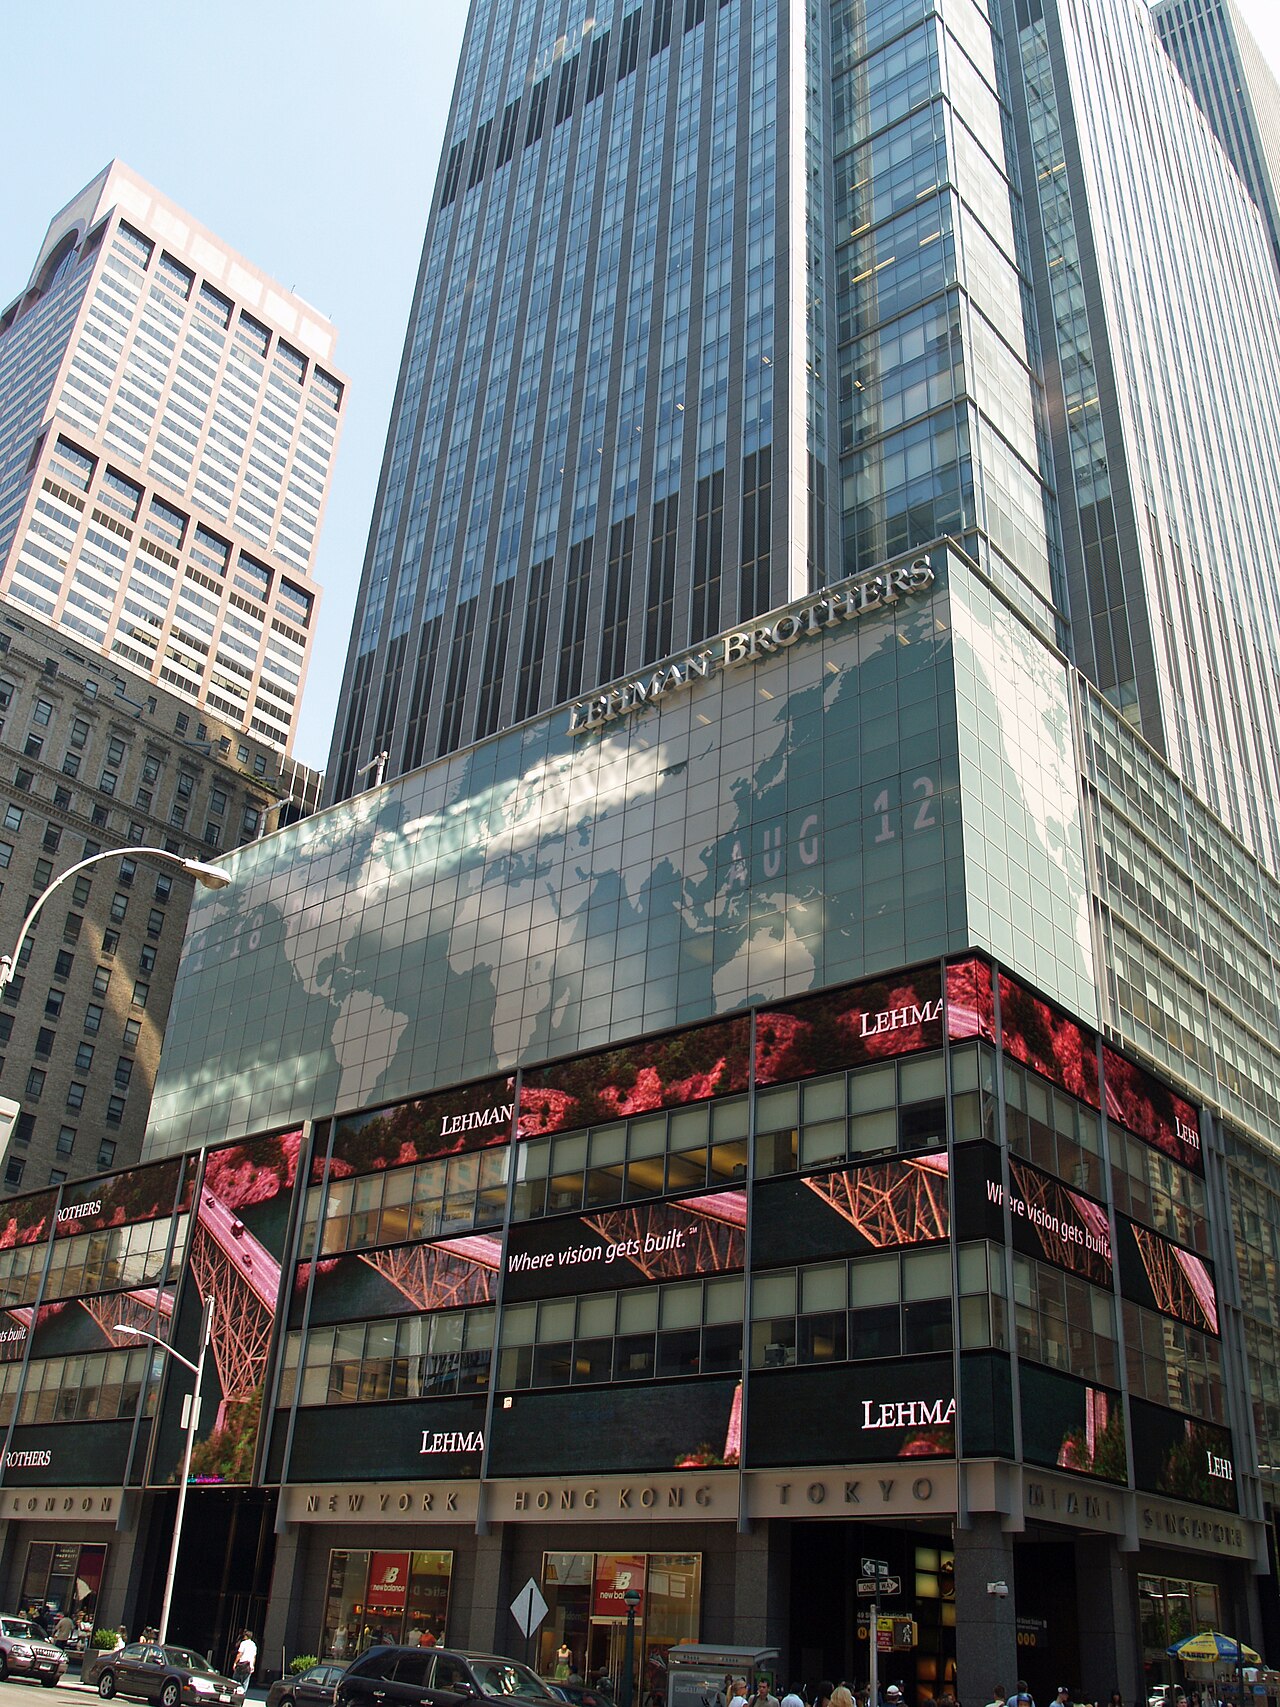
Lehman Brothers' Manhattan headquarters photographed in August 2007, before the firm's 2008 bankruptcy.
Exhibit 09 — Lehman Brothers headquarters / Manhattan / August 2007 / CC BY-SA 3.0David Shankbone via Wikimedia Commons

The housing boom fed mortgages into securities, leverage, ratings, bank balance sheets, and funding markets. When home prices turned, losses appeared in places that had looked distant from a house and a borrower.

On the plate. Lehman Brothers' New York headquarters was photographed in 2007, before the bankruptcy that came to symbolize the crisis. The lesson in the image is not that one building caused the collapse. It is that a familiar name can hide a balance sheet few outsiders can truly see.

Risk does not disappear when it is packaged. It becomes harder to trace. If nobody can follow the chain from the original asset to the final exposure, confidence can vanish all at once.

10

Market data

Fragmented markets

A crash measured in minutes

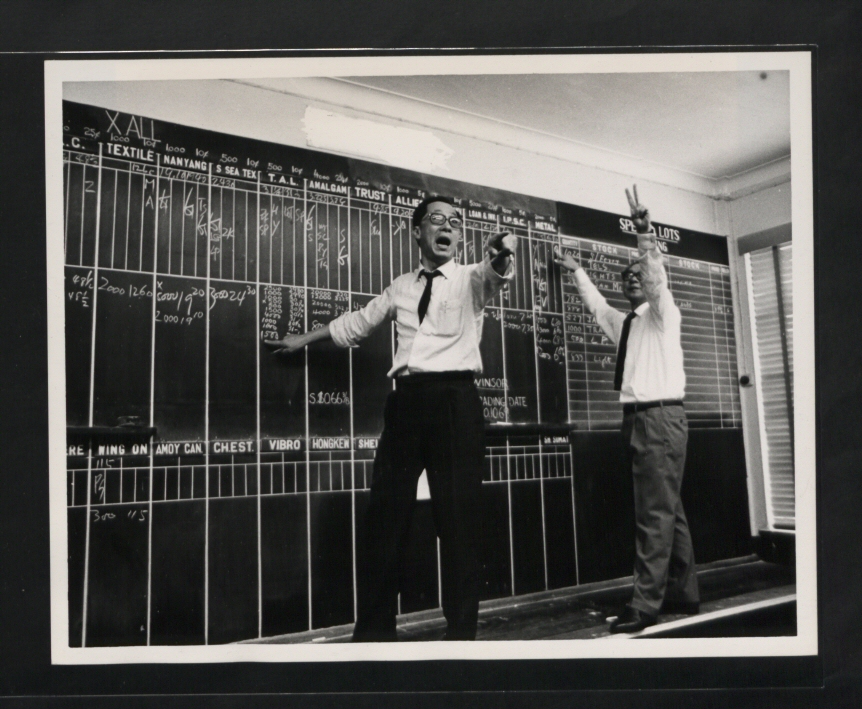
Brokers working amid telephones, papers, and visible trading activity on the Hong Kong exchange in 1969.
Exhibit 10 — Hong Kong stock exchange / the visible market / 1969The National Archives UK via Wikimedia Commons

On May 6, 2010, prices fell and recovered at a speed that made the event hard to understand while it was happening. Some securities briefly printed at absurd levels. Reconstructing the episode exposed how difficult it was to see one market spread across many venues.

On the plate. The Hong Kong exchange in 1969 looks crowded, but the activity is still visible in one room. The modern contrast is useful: today's crowd is software, orders, venues, and feeds. The room became easier to photograph just as the market became harder to see.

If a market cannot reconstruct what happened, it cannot learn much from the failure. This is the clearest link to Eastern Pine Ventures: better intelligence starts with a record good enough to question.

End note

The machinery changes. People do not change nearly as fast.

Every era gets a new feed, a new instrument, or a new promise that this time the old rules no longer apply. The point of keeping history close is not to predict the next crash. It is to ask better questions before it arrives, and to keep enough evidence to learn afterward.

Return to Eastern Pine Ventures